A recent discussion on weather apps put me in mind of weather maps and how to interpret and make you own weather judgements, based on these charts and your own experience of Irish hills & weather. Met Éireann often comes in for criticism which is unwarranted given the changeable nature of our weather. So look up the weather maps, read or listen to the Met Éireann summary and then learn to interpret for your own location! I’m no expert on such matters, I just combine basic Leaving Cert geography with knowledge of hills along with observation & experience. You can do the same! A handy source for current weather maps is www.met.ie/forecasts/atlantic-charts/precipitation-pressure Here’s a few basic pointers to start with:
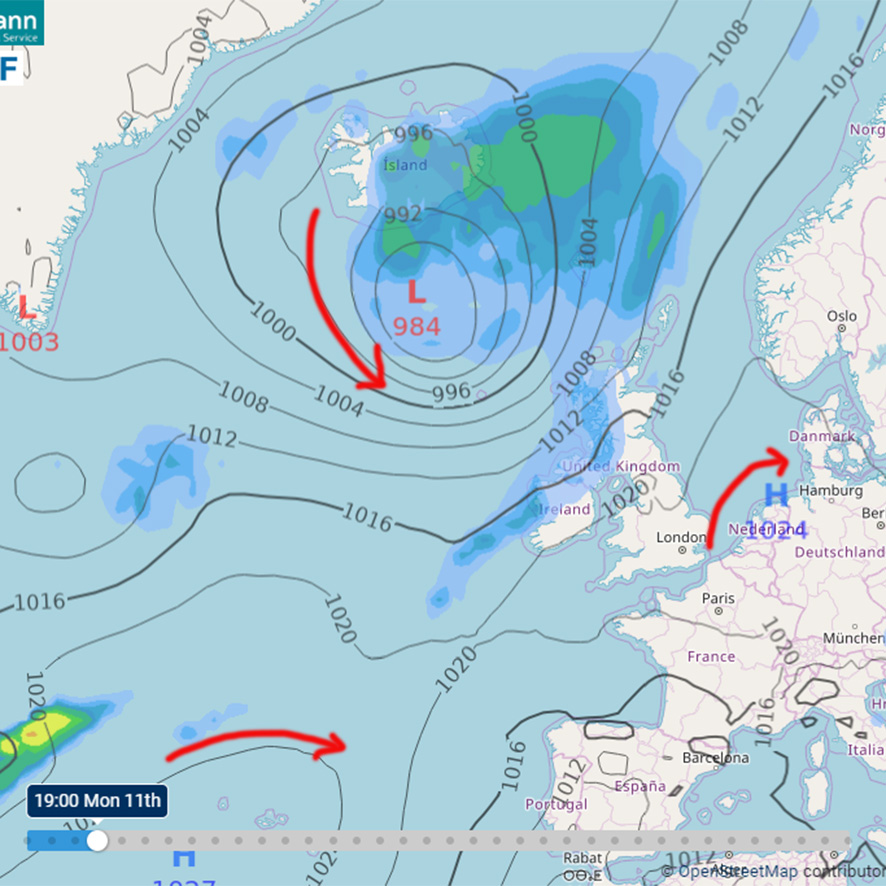
– A weather map or synoptic chart differs from a topographic map in that it’s constantly changing. A chart as pictured here is only a record of some moment in the past, an estimate of the present or a prediction of the future. Press the Play button on above link to see how the map changes as the air masses move and circulate.
– Isobars look like contour lines. But isobars represent points of equal air pressure whereas contour lines show points of equal height. On a topographic map, the closer the contour lines are – then the steeper the hillside. On a weather map, the closer the isobars are – then the windier the weather and the more active the weather system. Widely spaced isobars indicate slack winds and benign weather generally.
– Areas of low air pressure or cyclones are labelled with the letter L. Areas of high air pressure or anti cyclones are labelled with the letter H.
– Air/ Wind circulates anti clockwise around areas of L low pressure. Air/ Wind circulates clockwise around areas of H high pressure.
Knowing these basic facts, at any given place, you can predict the direction of the air/wind and it’s likely strength. So on this weather map, Donegal has roughly winds coming from the west but also potentially influenced by air from the cooler north Atlantic. As you go NW from Donegal, the isobars tighten and the wind will be stronger. Whereas down in Cork & Waterford, the winds are light but coming from the south west, influenced by warm southerly air coming up from Spain.
To be continued.
#eastwestmapping